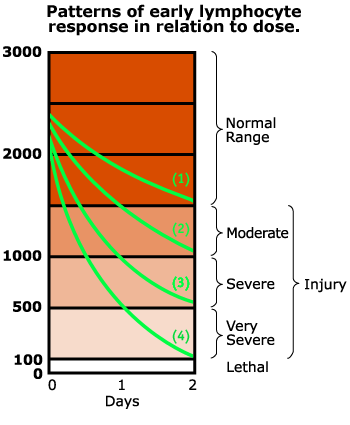
Lymphocyte Depletion Kinetics Graph - Illustration

 |
Andrews Lymphocyte Depletion Curves
Adapted from Goans, Ronald E., Holloway, Elizabeth C., Berger, Mary Ellen, and Ricks, Robert C. "Early Dose Assessment Following Severe Radiation Accidents," Health Physics 72(4): 1997; and Guidance for Radiation Accident Management (REAC/TS) |

