|
|
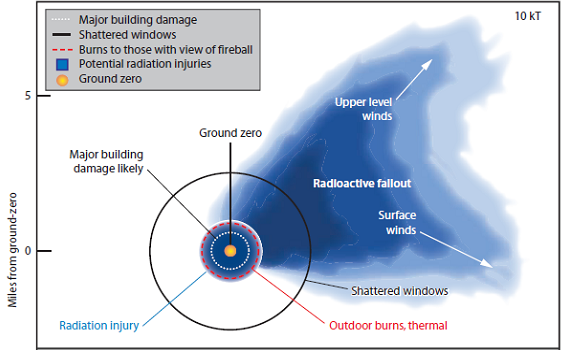
- Graphic display shows hypothetical, computer-modeled zones of damage, injury, and radiation levels after 10kT ground burst of an improvised nuclear device
- Linear scale of miles on both the x and y-axis
- Zones are approximate and would likely change over time during an event
- Irregular darker blue areas on the right half of the diagram reflect areas of potential radioactive fallout
- Note that weather and wind affect where fallout goes over time
- Upper winds carry fallout in one direction.
- Winds nearer to the earth's surface carry fallout in another direction
- This difference is frequently seen, even with normal weather patterns
- Both upper and lower winds can change direction normally, and during an event
|